The IS-8 Sectors: what does the new Industrial Strategy mean for local places?
- Wednesday, July 2, 2025
- Posted By Nathan Shoesmith
The UK Government has released its new Modern Industrial Strategy, setting out a 10-year plan that aims to deliver the certainty and stability needed to drive investment and deliver the national growth mission. The strategy will have a range of implications for local areas across the UK, particularly through the focus on the IS-8 sectors and the new Sector Plans.
Growth Flag has analysed the IS-8 sectors, allowing local places to see how many businesses they have in the sectors, how many have high growth potential, and how their region compares to the national average.
The IS-8 Sectors are 8 sectors identified by the UK Government in the new Industrial Strategy as sectors that will be key to driving future growth. These sectors include:
For each sector, the Government has defined a specific focus and interventions through Sector Plans.
As part of the new Industrial Strategy, the Government has identified specific combined authority areas, clusters and regions which have strengths in each of the IS-8 sectors and that will play an important role in driving future growth. It is expected that these areas will be the primary focus for future investment and strategic interventions. Other areas can still have important roles as key parts of the sectors and their supply chains.
Each Sector Plan outlines the Government's assessment of the most important places for the sector, while the overall Industrial Strategy policy package is directed towards ‘multi-sector’ city regions across the UK. The Government has acknowledged that there is no one-size-fits-all approach to identifying or prioritising city regions and clusters, and this analysis is not a final judgement on where to support.
Growth Flag has analysed the IS-8 sectors across the UK to help identify where these businesses are, how many have high growth potential, and how this growth potential compares to the UK average.
Growth Flag's first-of-its-kind innovative Growth Score identifies which businesses are likely to achieve 20% growth over the next year, currently with over 90% accuracy. Rather than just looking at historic data or a small proportion of businesses, we look across the economy to give a more comprehensive view of which places and businesses can support future growth. Our data highlights that growth and growth potential can be found throughout the UK, including in places you might not expect.
We've developed a tool that enables you to download a free report on the IS-8 sectors in your place. You can download your report here.
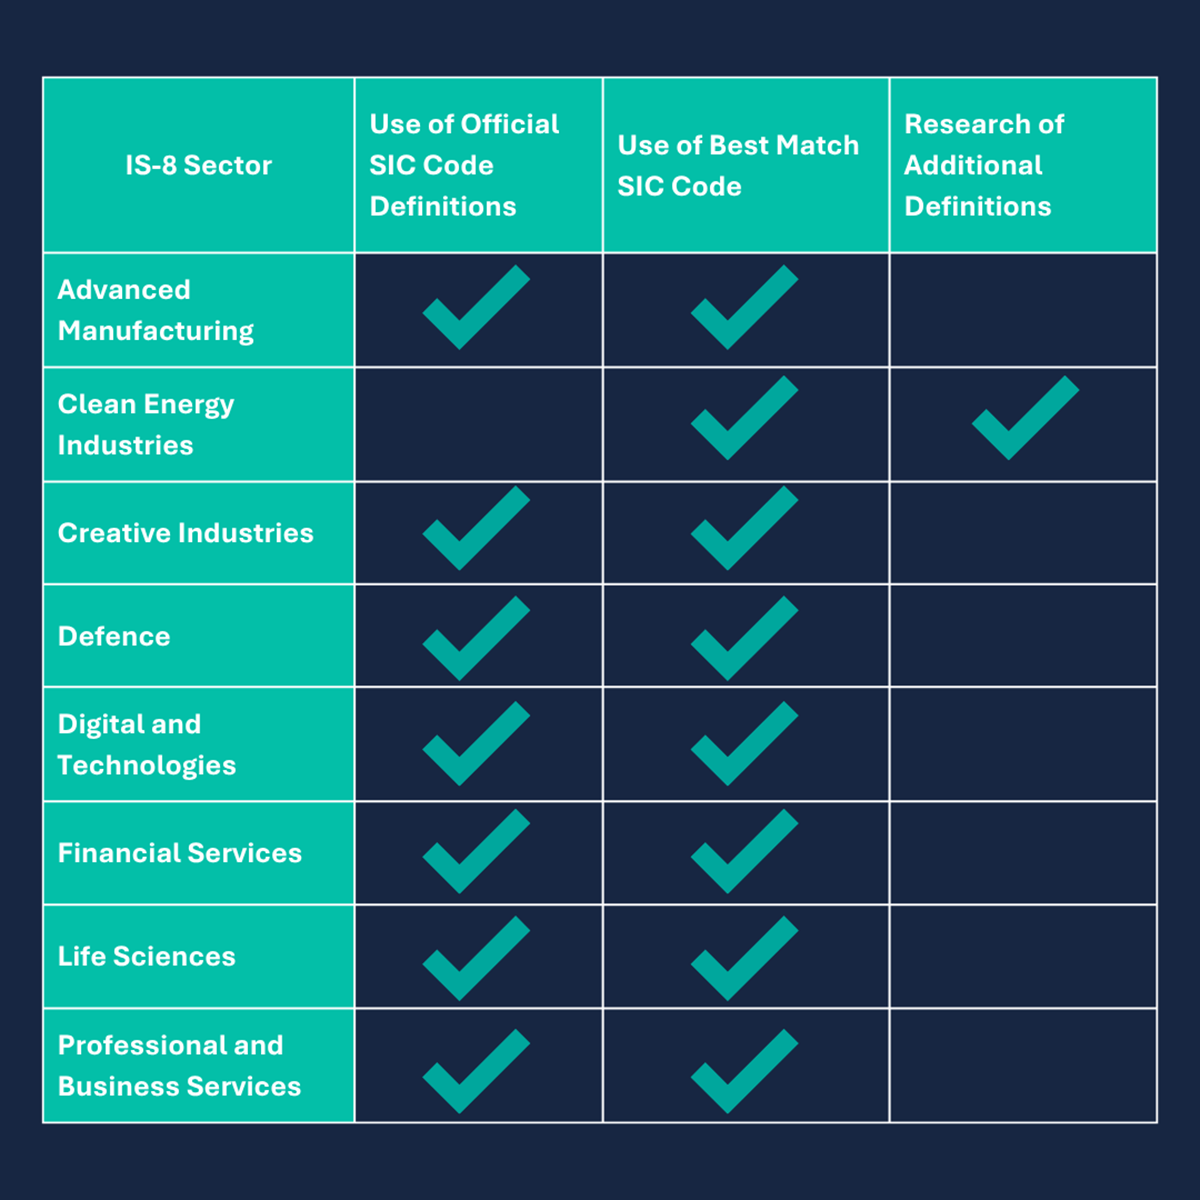
The IS-8 contains a range of emerging and more traditional industries and as such are difficult to analyse purely through the use of SIC codes. The UK Government has used a mixed approach to defining sectors including the SIC code system and other bases more relevant to each sector. For most sectors, a list of SIC codes have been provided by the Government here.
The challenges around the use of SIC codes are widely acknowledged. Many modern industries don't fit neatly into SIC codes and many businesses misclassify their SIC codes. That's why, in order to map the IS-8 sectors, Growth Flag has used a mixed approach to provide more comprehensive coverage.
Where available, we have used official sector definitions - but crucially in addition to the use of our Best Match SIC code technology. The Best Match SIC code doesn't just rely on what a business files as its SIC code - it uses the available information to identify any other relevant sectors the business is thought to be operating in. For each sector, the sector definitions cover both standard and frontier sectors. Frontier sectors are harder to capture but the Best Match SIC code can help us to provide better coverage overall. For some sectors such as Defence, the sector definition is narrow in the Industrial Strategy and more businesses (such as dual civilian/defence businesses) may appear in other sectors such as Advanced Manufacturing.
Where official sector definitions are not available, we have worked with our wider research team at GC Insight to identify the best matches.
Table: Growth Flag's use of sector definitions in place-based IS-8 reports
Our initial analysis of the sector isn't designed to tell you exactly what each IS-8 sector means for you. Each sector and place is unique, and some areas will have focuses that expand beyond the definitions used here.
Rather than providing a set of universal definitions, our reports for each place highlight how your area compares to the IS-8 sector based on the national average. This comparison considers the percentage of businesses in each sector that are likely to grow by 20% over the next year in any given place, and the difference between this and the overall national average. Businesses may fit in more than one sector so there may be double counting across the eight sectors, but not within each individual sector.
The growth potential comparisons are based on our Growth Score. This provides a more comprehensive view of growth by not being biased for or against any particular sub-sectors of the economy, and by using multi-variate analysis to identify the most appropriate metrics of growth for each individual business. The reports look at active businesses which have a registered and/or trading address in each area.
Within the Growth Flag platform, we can show you much more - including the value of these businesses, which are in financial distress, their demographics and much more. Our insights and analysis team can support you to use these insights in strategies, investment plans and business support interventions.
Download you free report on the IS-8 sectors in your area here.
